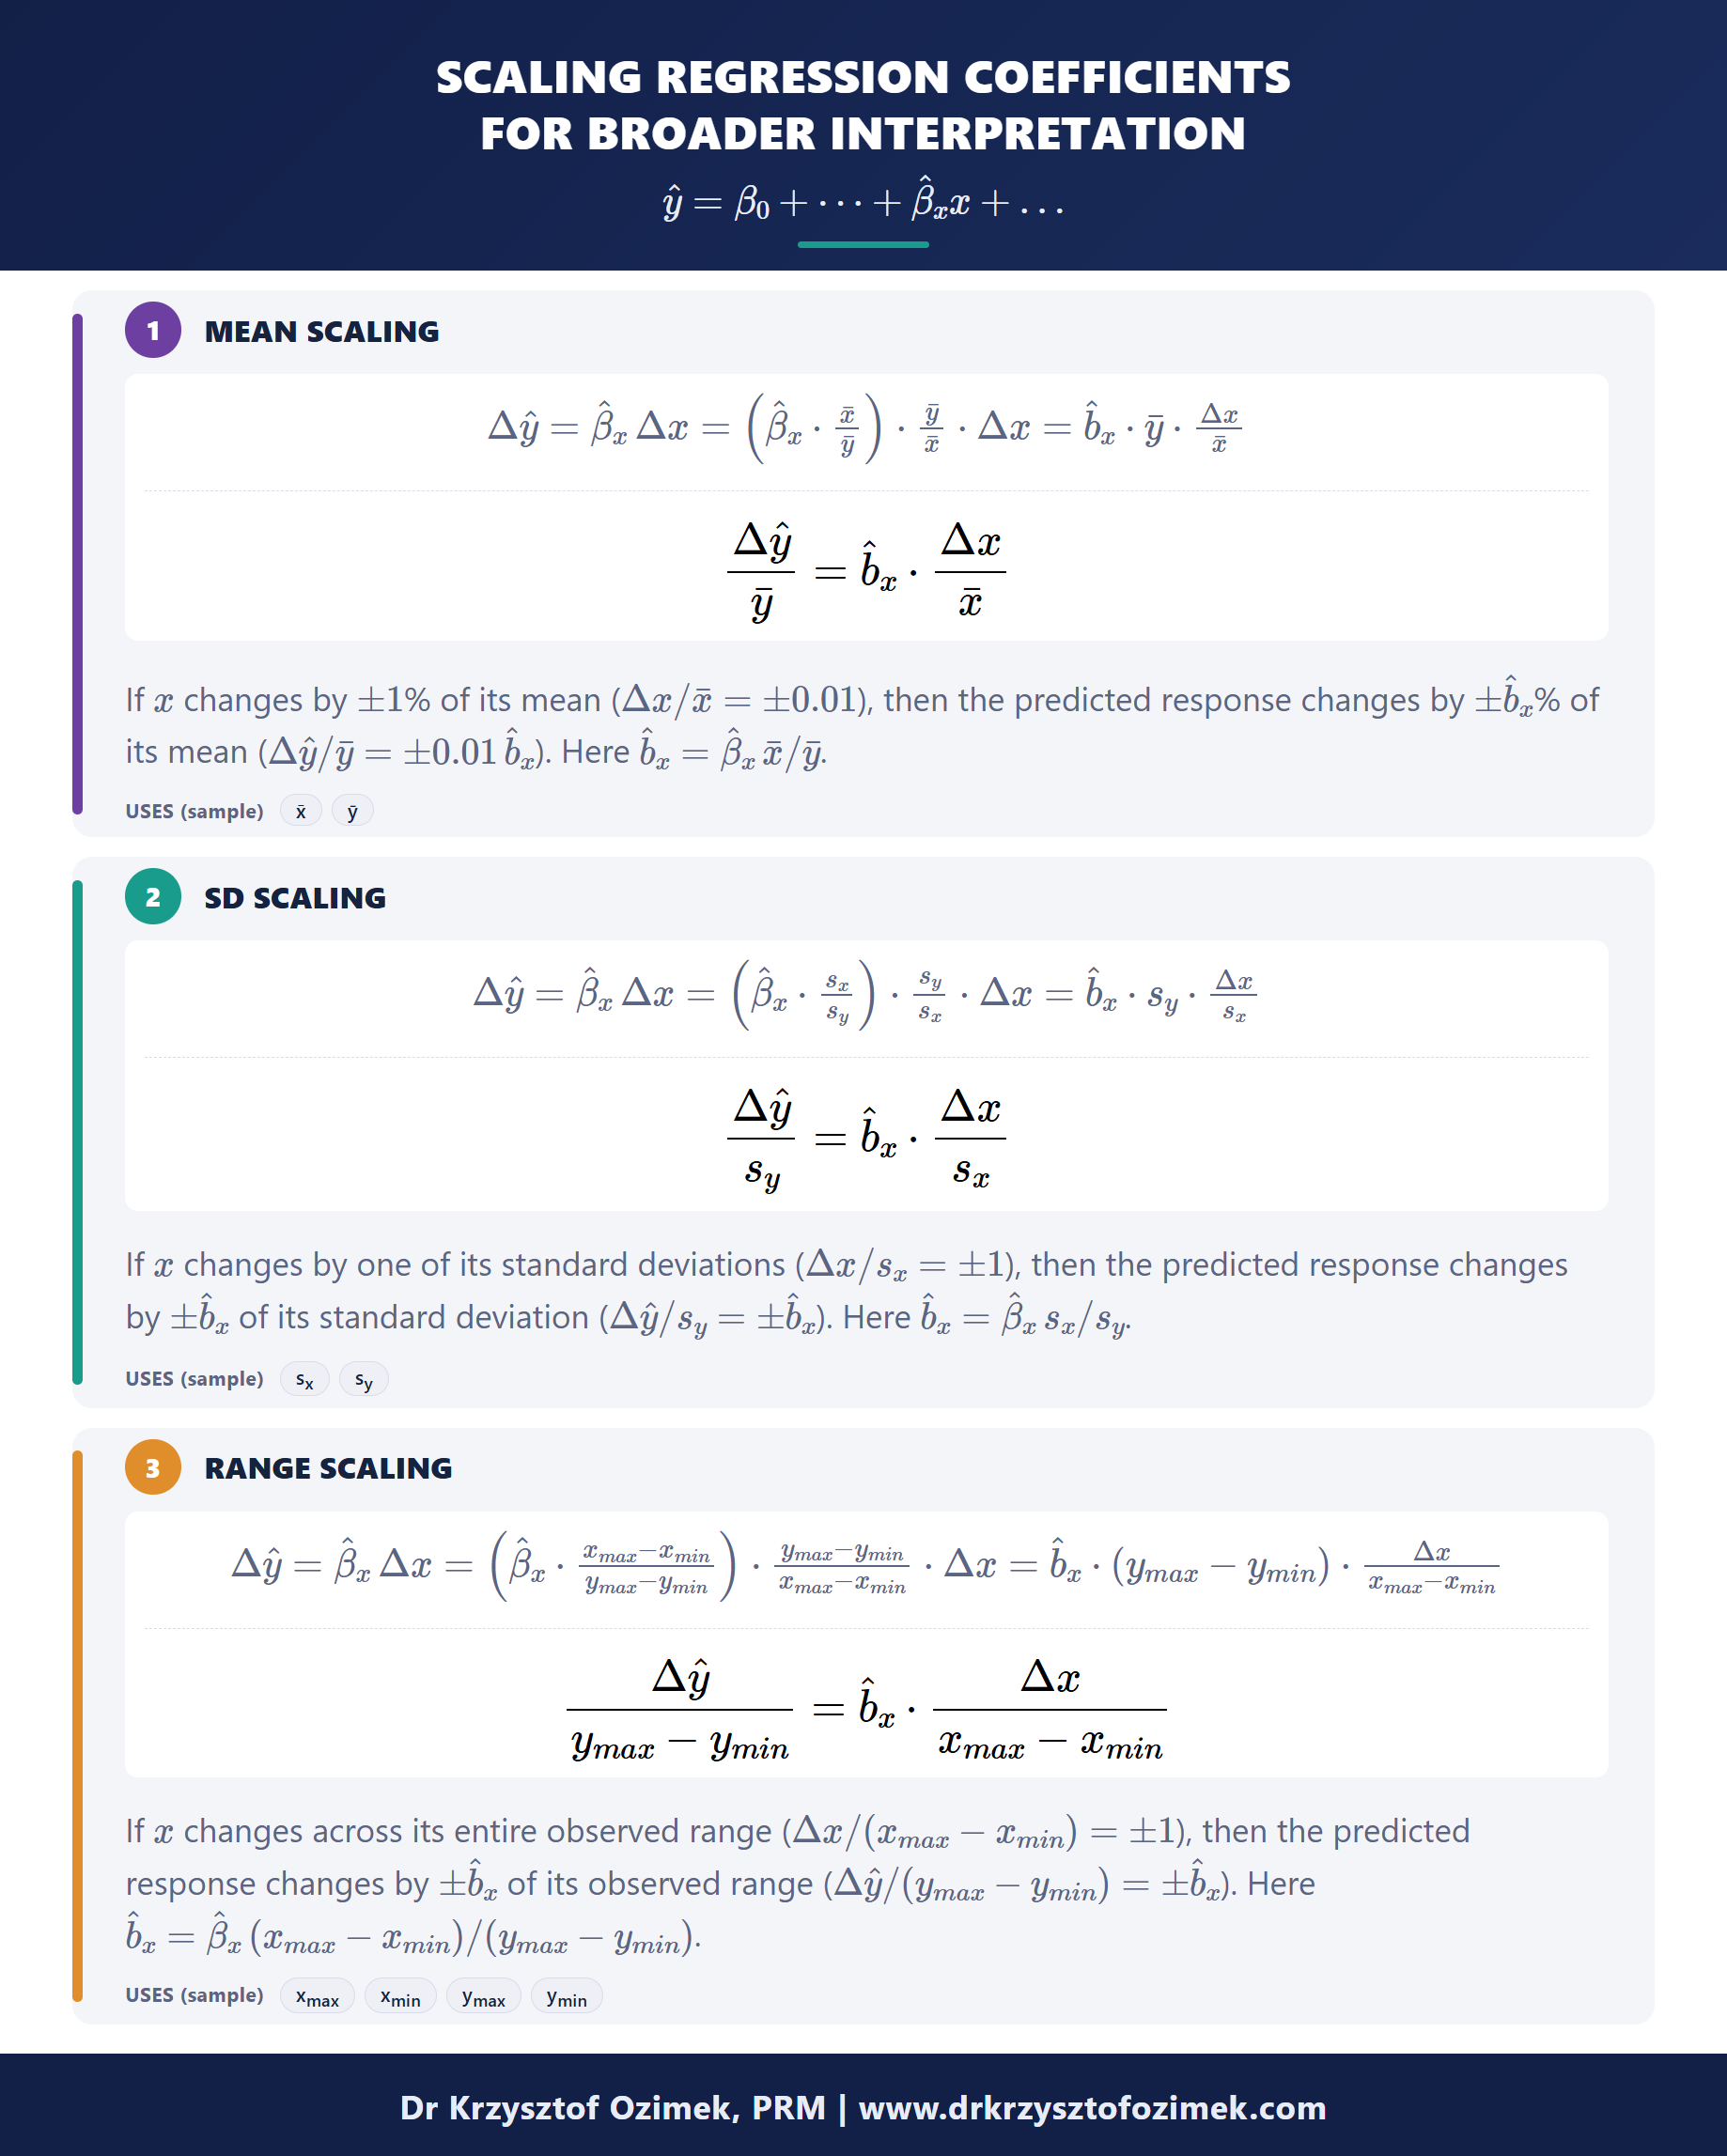
Scaling Regression Coefficients for Broader Interpretation
Behind many of the most influential models in quantitative finance lies a surprisingly simple idea: linear regression. Its success is driven not only by its straightforward mathematical structure but also by its ability to produce interpretable results, solve real-world financial problems, and serve as the foundation for an entire family of linear factor models.
Interpretability, however, extends well beyond the standard textbook explanation. While we often interpret a regression coefficient as the expected change in the response variable associated with a one-unit increase in the predictor, alternative scalings of the same estimated coefficient can reveal entirely different insights—all from the very same fitted model and without any re-estimation.
Three unconventional lenses:
- Mean scaling
- SD scaling
- Range scaling
Same model. Different scaling. Purpose-built interpretations.
Full derivations and interpretations in the graphic. What other insights can scaling reveal?