Skip to content
Cropped version of the official logo of Dr Krzysztof Ozimek, representing quantitative finance education and research.
  • About
  • Contact
  • Blog
  • Books
  • Multi-Method VaRCalc
  • Algorithmic Trading Models
  • QuantFin Services
Edu Hub
Cropped version of the official logo of Dr Krzysztof Ozimek, representing quantitative finance education and research.
Dr Krzysztof Ozimek
Edu Hub
  • Attending “Machine Learning for Trading in the Age of AI Agents” — Live Workshop with Stefan Jansen

    Quantitative Finance

    Attending “Machine Learning for Trading in the Age of AI Agents” — Live Workshop with Stefan Jansen

    Dr Krzysztof Ozimek, a Quantitative Investment & Trading Research EducatorDr Krzysztof Ozimek

    This is a build-along workshop, not a lecture: attendees go from generating to validating and refining an end-to-end ML trading strategy with real ETF market data — using AI coding agents to build the feature engineering, model training, and backtesting pipeline, and AI research agents to generate, validate, and refine the trading ideas themselves.

    Read More Attending “Machine Learning for Trading in the Age of AI Agents” — Live Workshop with Stefan JansenContinue

  • Diagram comparing probability distributions of trading strategies A and B, showing why a single higher performance value (V_B) doesn't mean strategy B is truly better than A
    Quantitative Finance

    Is B Really Better Than A? A Trading Strategy Comparison

    Dr Krzysztof Ozimek, a Quantitative Investment & Trading Research EducatorDr Krzysztof Ozimek

    How a single-value performance metric can distort the ranking of trading strategies — and how to avoid falling for it and gain deeper insight into strategy comparison.

    Read More Is B Really Better Than A? A Trading Strategy ComparisonContinue

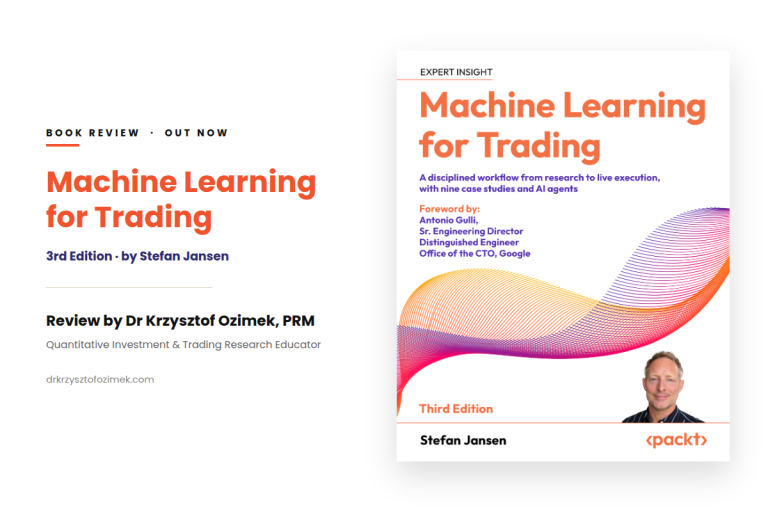
  • Light banner graphic with a colorful orange-purple-pink wave motif and a book cover mockup, reading "Book Review — Machine Learning for Trading by Stefan Jansen, Third Edition, Packt," reviewed by Dr Krzysztof Ozimek, PRM, Quantitative Finance Educator & Researcher.
    Quantitative Finance

    Machine Learning for Trading, 3rd Edition — Book Review

    Dr Krzysztof Ozimek, a Quantitative Investment & Trading Research EducatorDr Krzysztof Ozimek

    Gifted review copy from Packt Publishing — honest, unpaid opinion below.

    Just finished reviewing Stefan Jansen’s Machine Learning for Trading, 3rd Edition (Packt, 2026), several days after publication.

    Read More Machine Learning for Trading, 3rd Edition — Book ReviewContinue

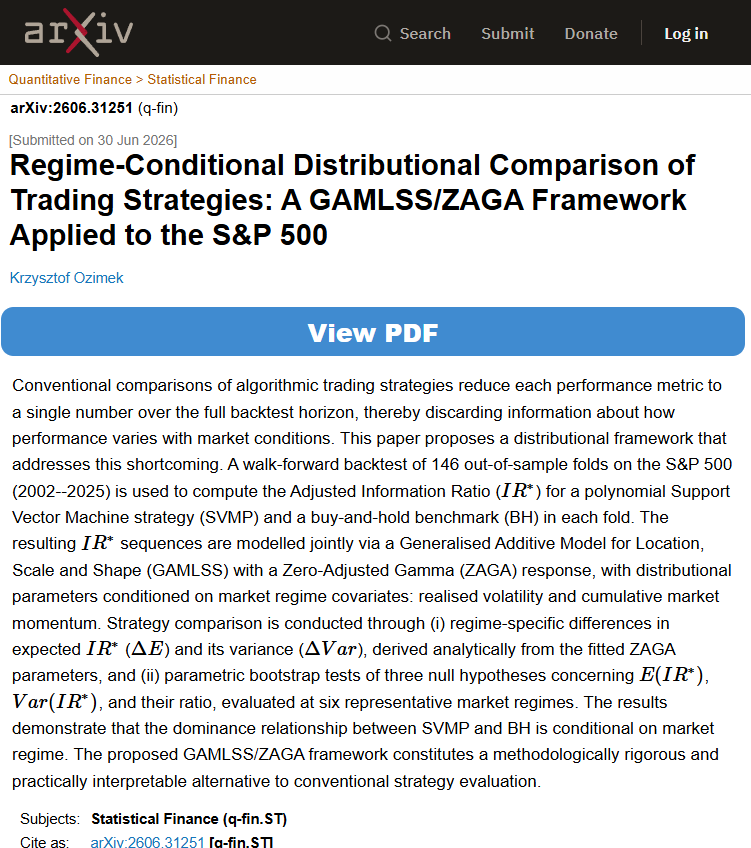
  • GAMLSS ZAGA model of conditional Adjusted Information Ratio (IR*) distribution for SVMP vs buy-and-hold strategy, S&P 500 walk-forward backtest
    Quantitative Finance

    Beyond the single scalar: uncovering a trading strategy’s conditional performance distribution

    Dr Krzysztof Ozimek, a Quantitative Investment & Trading Research EducatorDr Krzysztof Ozimek

    I wrote my newest paper mainly to challenge the conventional way of judging an investment or trading strategy through a single observational point of its performance metric — an approach that discards precious information about…

    Read More Beyond the single scalar: uncovering a trading strategy’s conditional performance distributionContinue

  • Dark banner graphic with orange hexagon and pulse-line motif, reading "Book Review · Out Now — Python for Algorithmic Trading Cookbook, 2nd Edition by Jason Strimpel," reviewed by Dr Krzysztof Ozimek, PRM, Quantitative Investment & Trading Research Educator.
    Quantitative Finance

    Python for Algorithmic Trading Cookbook, 2nd Edition — Book Review

    Dr Krzysztof Ozimek, a Quantitative Investment & Trading Research EducatorDr Krzysztof Ozimek

    Gifted review copy from Packt Publishing — honest, unpaid opinion below. This is a genuinely useful reference for anyone building trading systems in Python. The recipe format is the book’s greatest strength — plenty of self-contained recipes spanning data acquisition, data wrangling, and visualization; building fundamental data screeners; factor trading; backtesting (both vector-based and event-based) and its evaluation; and using the IB API for historical and streaming data in portfolio building and management.

    Read More Python for Algorithmic Trading Cookbook, 2nd Edition — Book ReviewContinue

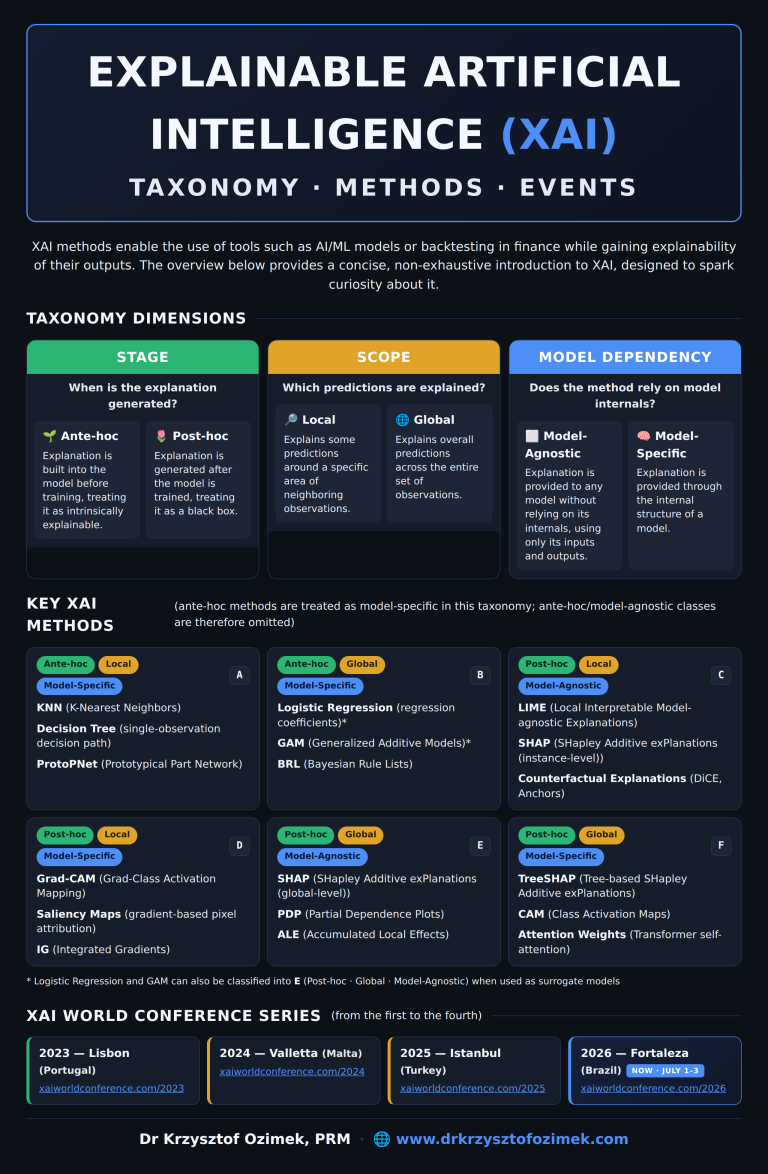
  • Infographic on Explainable AI (XAI) showing taxonomy dimensions (stage, scope, model dependency), key XAI methods including SHAP, LIME, and Grad-CAM, and the XAI World Conference series 2023–2026
    Quantitative Finance

    Explainable AI (XAI): Taxonomy, Methods & Events

    Dr Krzysztof Ozimek, a Quantitative Investment & Trading Research EducatorDr Krzysztof Ozimek

    XAI methods enable the use of tools such as AI/ML models or backtesting in finance while gaining explainability of their outputs.

    Read More Explainable AI (XAI): Taxonomy, Methods & EventsContinue

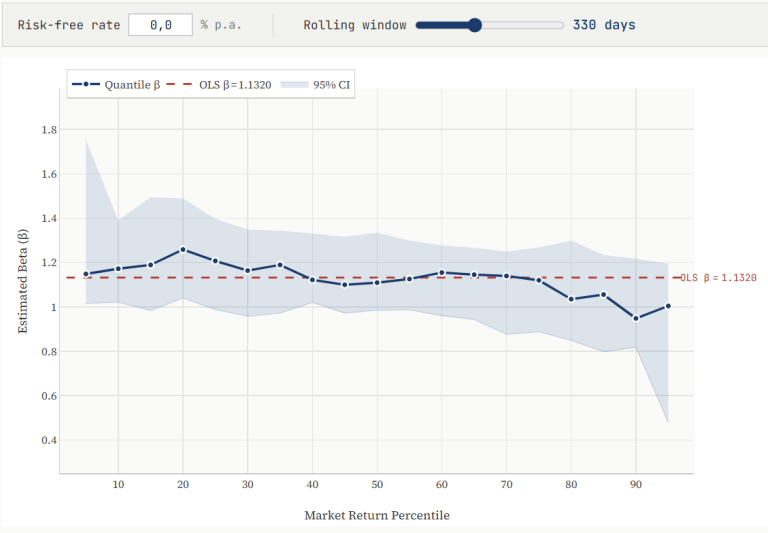
  • Quantile surface showing the conditional distribution of equity returns across beta levels, illustrating nonlinear distributional effects beyond the traditional linear CAPM interpretation.
    Quantitative Finance

    Beta Is Not Linear: Distributional Effects in Equity Markets

    Dr Krzysztof Ozimek, a Quantitative Investment & Trading Research EducatorDr Krzysztof Ozimek

    Introduction The Capital Asset Pricing Model (CAPM) represents an asset’s market sensitivity using a single scalar (beta), estimated by ordinary least squares on the full return distribution.

    Read More Beta Is Not Linear: Distributional Effects in Equity MarketsContinue

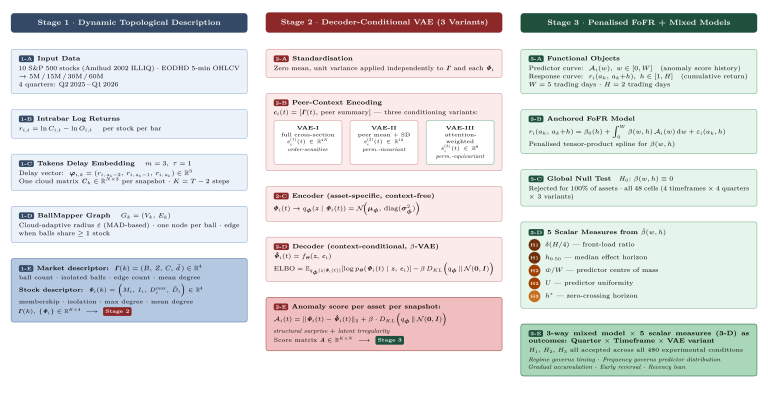
  • Three-stage research methodology diagram: dynamic topological description via BallMapper, decoder-conditional VAE anomaly scoring, and penalised Function-on-Function regression for intraday return predictability.
    Quantitative Finance

    Can the Topological Shape of the Market Predict How Returns Evolve?

    Dr Krzysztof Ozimek, a Quantitative Investment & Trading Research EducatorDr Krzysztof Ozimek

    I am pleased to announce that my new paper is now available:

    “Cross-Sectional Topological Anomaly Scores and Intraday Return Predictability: BallMapper Descriptors, Decoder-Conditional VAE, and Function-on-Function Regression on S&P 500 Intraday Data”

    Read More Can the Topological Shape of the Market Predict How Returns Evolve?Continue

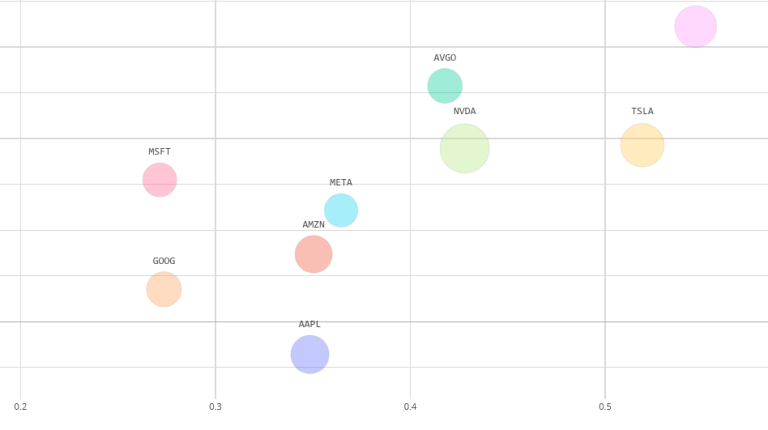
  • Bubble chart showing rolling risk–return dynamics for ten S&P 500 equities (AAPL, AMZN, AVGO, GOOG, META, MSFT, NVDA, TSLA and others) over April 2025–March 2026, with standard deviation on the x-axis, mean return on the y-axis, and bubble size proportional to trading volume.
    Quantitative Finance

    Dynamic Rolling Risk–Return‑Volume Insight: Ten Highly Liquid S&P 500 Constituents

    Dr Krzysztof Ozimek, a Quantitative Investment & Trading Research EducatorDr Krzysztof Ozimek

    The chart visualizes rolling risk–return–volume dynamics for ten highly liquid S&P 500 constituents — AAPL, AMZN, AVGO, GOOG, GOOGL, META, MSFT, NVDA, PLTR, and TSLA — selected, over the April 2025–March 2026 period, by ranking all index members on the Amihud (2002) illiquidity ratio — a widely used measure of price impact per unit of trading volume — and retaining the ten most liquid stocks. Intraday OHLCV data for that period were sourced from EODHD (eodhd.com) at 5‑minute resolution and then aggregated to the 15‑, 30‑, and 60‑minute frequencies.

    Read More Dynamic Rolling Risk–Return‑Volume Insight: Ten Highly Liquid S&P 500 ConstituentsContinue

  • Abstract financial visualization representing algorithmic trading and market structure.
    Quantitative Finance

    Simpson’s Paradox in Trading: When Aggregation Reverses Algorithm Rankings

    Dr Krzysztof Ozimek, a Quantitative Investment & Trading Research EducatorDr Krzysztof Ozimek

    When evaluating trading algorithms, it is common to compare their average performance across the entire dataset. But if algorithms are used differently across market regimes, aggregated performance can produce a completely false ranking. The example below shows how an algorithm that is worse in every regime can appear superior overall.

    Read More Simpson’s Paradox in Trading: When Aggregation Reverses Algorithm RankingsContinue

Page navigation

Previous PagePrevious 1 2 3 4 5 Next PageNext
Disclaimer

All content made available through drkrzysztofozimek.com, including but not limited to digital products, courses, textbooks, articles, and newsletters, is provided for educational purposes only.

We do not provide financial, investment, or trading advice. The information is not intended as a recommendation or solicitation to buy, sell, or hold any financial instrument. You acknowledge that you use the information provided at your own risk.

Eduinn Krzysztof Ozimek shall not be held liable for any loss, damage, or consequences resulting directly or indirectly from reliance on such information.

Eduinn Krzysztof Ozimek

ul. Kryształowa 31/21
01-356 Warsaw
Poland

NIP 526 225 97 76

Telephone: +48 796 594 098
E-mail: contact@drkrzysztofozimek.com

Quantocracy featured quant finance blog badge

  • Terms
  • Privacy Policy
  • Cookie Policy (EU)
  • Contact
  • About
  • Blog
  • Edu Hub
  • Multi-Method VaRCalc
  • Algorithmic Trading Models
  • QuantFin Services

Research

SSRN
arXiv
ORCID

© 2026 Dr Krzysztof Ozimek

Linkedin Facebook YouTube
Manage Consent
To provide the best experiences, we use technologies like cookies to store and/or access device information. Consenting to these technologies will allow us to process data such as browsing behavior or unique IDs on this site. Not consenting or withdrawing consent, may adversely affect certain features and functions.
Functional Always active
The technical storage or access is strictly necessary for the legitimate purpose of enabling the use of a specific service explicitly requested by the subscriber or user, or for the sole purpose of carrying out the transmission of a communication over an electronic communications network.
Preferences
The technical storage or access is necessary for the legitimate purpose of storing preferences that are not requested by the subscriber or user.
Statistics
The technical storage or access that is used exclusively for statistical purposes. The technical storage or access that is used exclusively for anonymous statistical purposes. Without a subpoena, voluntary compliance on the part of your Internet Service Provider, or additional records from a third party, information stored or retrieved for this purpose alone cannot usually be used to identify you.
Marketing
The technical storage or access is required to create user profiles to send advertising, or to track the user on a website or across several websites for similar marketing purposes.
  • Manage options
  • Manage services
  • Manage {vendor_count} vendors
  • Read more about these purposes
View preferences
  • {title}
  • {title}
  • {title}
  • About
  • Contact
  • Blog
  • Books
  • Multi-Method VaRCalc
  • Algorithmic Trading Models
  • QuantFin Services
Search