
Tick, Volume and Dollar Bars in Python: A Test on SPY with EODHD Tick Data
Disclosure: EODHD provides me with free access to its data, which is used in this article. The article also contains an affiliate link to EODHD: if you sign up through it, I may receive a commission at no extra cost to you. The analysis and conclusions presented are my own and are for educational purposes only, not investment advice.
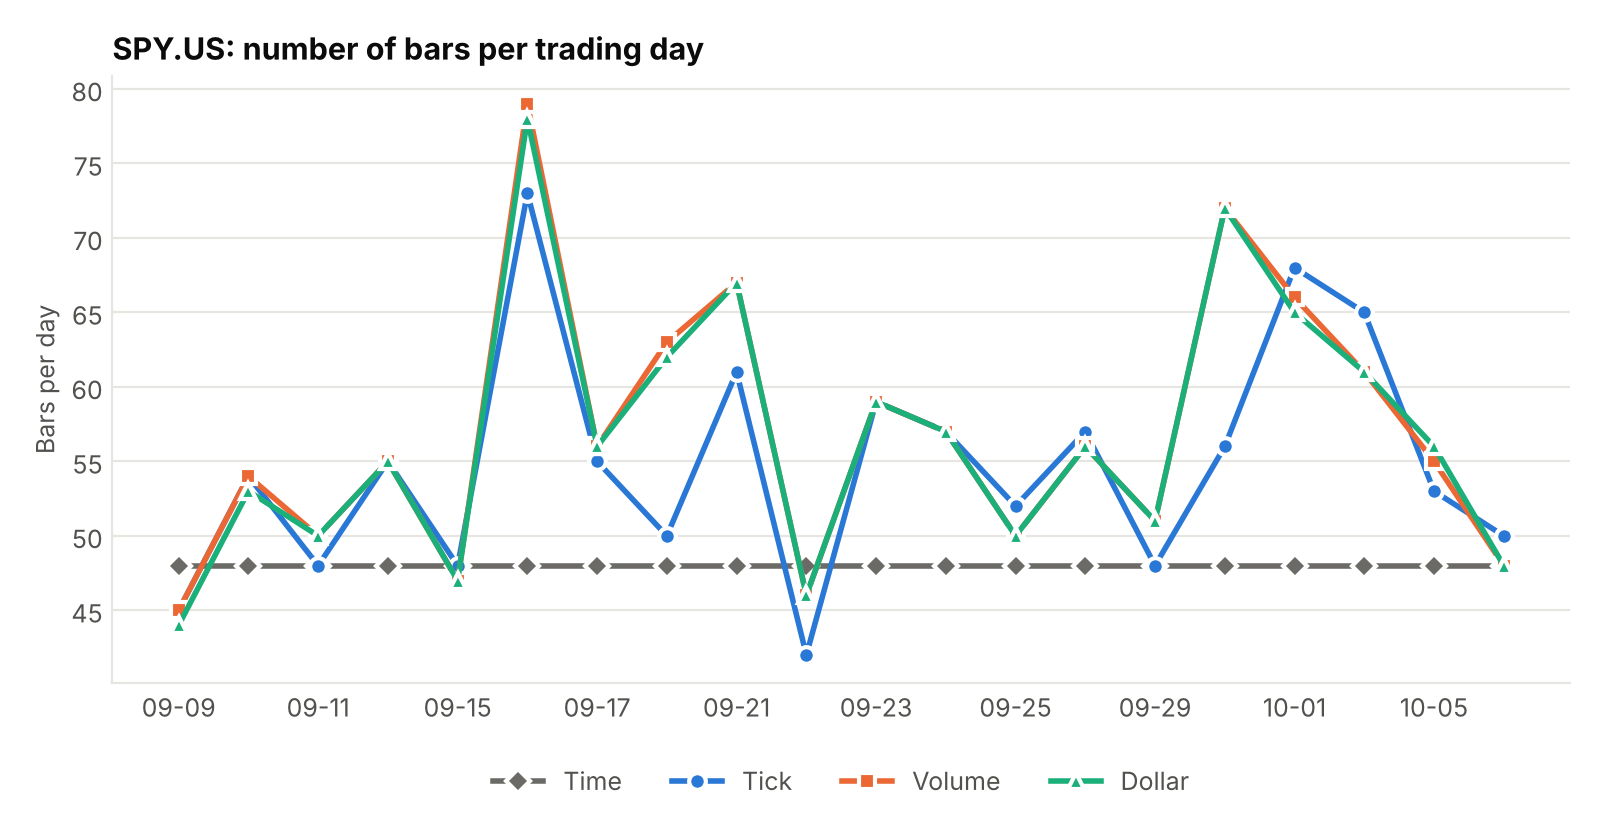
Typically, charts and models in finance look at the market on a clock: one observation every minute, every hour, every day. In Chapter 2 of Advances in Financial Machine Learning, Marcos López de Prado (2018) argues that this is a poor way to sample a market, because information does not arrive at a constant pace. Bars that close after a fixed number of trades, a fixed number of shares or a fixed amount of money traded should sample the market more evenly, and the returns of such bars should be better behaved.
Read the full article on EODHD Academy: Tick, Volume and Dollar Bars in Python with EODHD Tick Data: A Test on SPY
References
EODHD. (n.d.). EODHD Financial Data APIs [Data set]. Use my personal code DROZIMEK10 for 10% off your first purchase.

