
Why Volatility Alone Can Misrepresent Risk
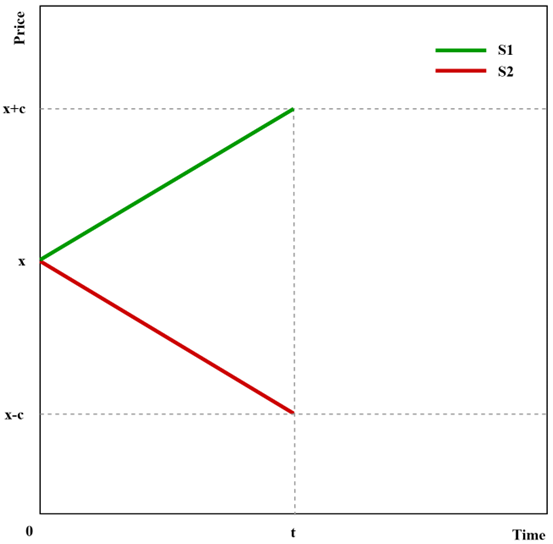
Volatility is widely used as a proxy for risk, largely because it is easy to compute and fits neatly into different models such as CAPM. Yet treating volatility as the measure of risk can be misleading. The simple price paths in the figure illustrate the problem clearly.
Why Volatility Is Not Enough
Two securities, S1 (green) and S2 (red), begin at the same price \(x\) and move linearly over the horizon \(t\). One ends higher at \(x + c\) and the other ends lower at \(x - c\). The paths are perfectly symmetric—one is a steady draw-up, the other a steady drawdown. Because their deviations from the common starting price are identical in magnitude, their volatilities are the same.
If volatility were an adequate measure of risk, these two securities would be considered equally risky. But from an investor's viewpoint, that conclusion is counterintuitive. S1 moves favourably throughout the entire period and finishes with a gain; S2 moves unfavourably and ends with a loss. The realised economic risk is completely different: one trajectory increases wealth, the other destroys it, yet volatility treats both as indistinguishable.
This example highlights a fundamental limitation: volatility captures dispersion, not direction. It reflects upside and downside movements equally.
For a methodological framework covering performance measures and backtest inference, see Scientific Backtesting.
Reference
Ma, L. (2025). Nonlinear investing: A quantamental approach. Springer Nature Switzerland AG.

